
Best practices of communicating the European Cohesion Policy in Slovenia
January 15, 2018
Andreja Pegan iz Dublina: “Evropski denar ne more kupiti ljubezni do Evropske unije.”http://www.rtvslo.si
February 5, 2018The aim of Cohesion policy is to provide support to less developed regions in the EU to boost the level of development in these regions: it aims to contribute by providing means for additional investments into growth-enhancing infrastructure, business and human capital investments.
Lack of additionality of EU support might undermine the effectiveness of the EU funds in bolstering the supply side of the supported regions depending on the actual size and pattern of the crowding out taking place. Without full additionality, the outcome will fall somewhere between two opposite outcomes. At one end, national resources may be freed up to support national expenditure that is not eligible to support under EU Cohesion policy but it is supportive of long term growth (such as for example ongoing current expenditure on education that is spent in a way that is expected to improve human capital outcomes in the national economy). At the other end, national resources may be freed up to fund expenditure without any tangible impact on long term growth (such as for example increasing government consumption without improving the quality of government or creating room for domestic public investments driven mainly by pork barrel). Clearly, the outcomes of these two scenarios in terms of economic development will be very different; eventual outcomes will fall somewhere in between these two.
Experience with additionality verification shows the difficulties for the European Commission to ensure that Member States adhere to the principle. Therefore, the process of additionality verification has been changed for 2014-2020: to comply with additionality, those Member States with a large share of population living in less developed regions[1] commit to maintain a pre-set average level of public investment at the national level[2]. This is reasonable, as the bulk of EU Structural Fund expenditure provides support to public investment (gross fixed capital formation within the general government, P51 in ESA2010, reported yearly by Member States in the context of the European Semester), and experience showed the difficulty of ensuring the additionality of those parts of EU support that do not contribute to public investment. This new method of verification aims to reduce the administrative burden for the Commission and for the Member States, and to improve transparency for all actors involved, including the public.
The 2007-2013 programming period under Cohesion policy has been strongly affected by the economic and financial crisis, which constrained the ability of Member State governments to keep up public investment. The 6th Cohesion report shows that between 2007 and 2013, the contribution of EU Structural and Cohesion Funds to public investment in the EU increased from 11,5 to 18,1% in the whole EU (European Commission 2014, Chapter 4, Figure 4.22, page 155): however, this change is an EU level average, affected by the public finances of net contributor countries and hence masks developments in countries that the main beneficiaries of EU support. Graph 1 thus shows trends in public investment and the actual inflows of the European Regional Development Fund, the European Social Fund and the Cohesion Fund in the 11 countries concerned by additionality in 2007-2016.

Graph 1. Public investment, EU fund inflows and additionality.
Yearly averages for 11 EU countries that are the major beneficiaries of EU Structural and Investment Funds: Bulgaria, Croatia, the Czech Republic, Estonia, Hungary, Latvia, Lithuania, Poland, Portugal, Romania and Slovakia. EU funds covered: European Regional Development Fund, European Social Fund, Cohesion Fund.
Sources: own calculations, public investment, GDP: Ameco; EU fund inflows: cohesiondata.ec.europa.eu, 2014-2020 additionality targets: Partnership Agreements, , https://ec.europa.eu/info/publications, 2007-2013 additionality outcomes: European Commission (2017).
In Graph 1, it is not feasible to directly assess the full contribution of EU fund inflows to national public investment, for two reasons. First, a part of EU fund inflows is not contributing to public investment, but rather support investments in the private sector, or consumption expenditure in the government. Still, a major share of EU funding does contribute to public investment. Second, EU fund inflow data is cash-based, while public investment data is accrual based[3]. Thus, the graph is useful to infer general tendencies[4].
Graph 1 shows that for the 2014-2020 verification of additionality, on average, the major beneficiaries committed to maintain a relatively low level of public investment. The average level they committed to is a historically low level of public investment, and the level is below the average level of national structural expenditure subject to additionality in 2007-13[5].
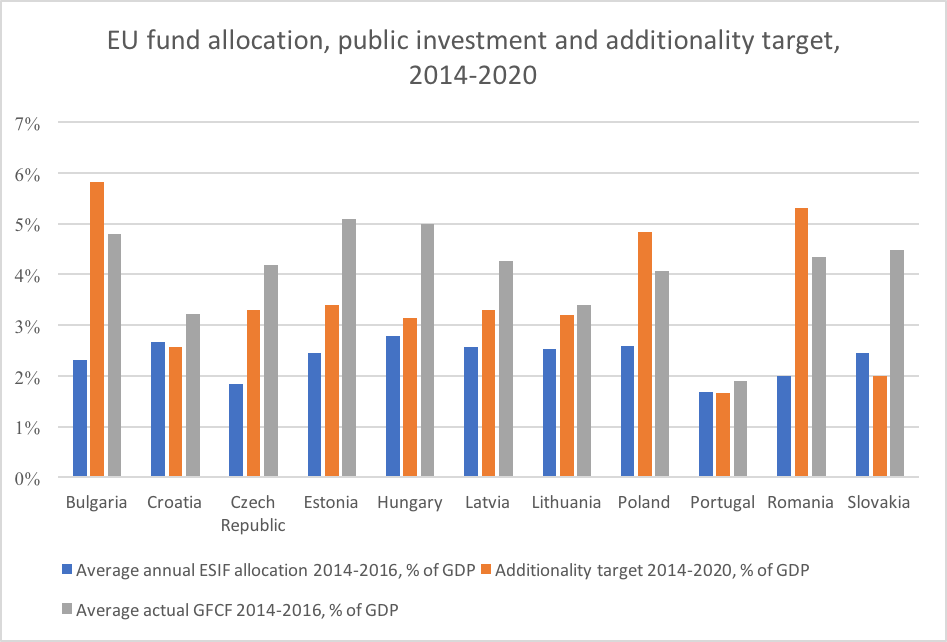
Graph 2. EU fund allocations, public investment and additionality commitments in the 11 main beneficiary EU countries. Source: EU fund allocations: cohesiondata.ec.europa.eu, public investment (GFCF): Ameco, additionality targets: Partnership Agreements for 2014-2020, ec.europa.eu/info/publications
In Graph 2, information since 2014 is provided by country, showing that while most countries committed to keep their public investment level near or below 3% of GDP over 2014-2020, some countries (Bulgaria, Poland and Romania) were more ambitious in their commitment, while their actual average 2014-2016 public investment levels fall short of their commitments. In the rest of the countries with a low commitment level, actual 2014-2016 average public investment levels are significantly higher than the commitment levels in the additionality verification exercise. Yet, as already highlighted above, these higher than committed levels of 2014-2016 public investment were triggered by the EU fund inflows of the 2007-2013 period.Graph 1 indicates that it would be interesting to dig further into whether EU Structural Funds are truly additional to national expenditure. Clearer evidence on the crowding out of national public investment by EU Structural Funds is provided by Mohl (2016), using panel regression methods, for the time period until 2006. His analysis cannot find a significant impact of EU funds on public investment levels in the EU, despite using various specifications and estimation methods. Graph 1 complements the analysis of Mohl (2016), providing information from 2007 on and focusing on the major new Member State beneficiaries of EU Cohesion policy.
Based on all the information available above, while Member States mostly meet the technical requirements of additionality, in an economic sense it is quite likely that in many Member States that are major beneficiaries of EU support, there was some crowding out of national public expenditure and national public investment by EU fund inflows since 2007. Thus, the open question is how the inflow of EU fund affected other aspects of government finances in these countries: whether it freed up national resources to support other types of growth-enhancing expenditure, or whether it was used in some other way that is less supportive of economic development.
References
European Commission (2014): Investment for Jobs and Growth. Promoting Development and Good Governance in EU Regions and Cities. Sixth Report on Economic, Social and Territorial Cohesion. Directorate General for Regional and Urban Policy, Brussels.
European Commission (2017): Ex post verification of additionality 2007-2013. Communication from the Commission, COM (2017) 138 final, 23.03.2017 Brussels.
Mohl, Philippe (2016): Empirical evidence on the macroeconomic effects of EU Cohesion Policy. Springer Gabler.
OECD: OECD Economic Surveys: Euro Area 2016
Anita Halasz COHESIFY Research Fellow at Central European University Center for Policy Studies
[1] These are 11 countries: Bulgaria, Croatia, the Czech Republic, Estonia, Hungary, Latvia, Lithuania, Poland, Portugal, Romania and Slovakia
[2]Countries where 15-65% of the population lives in less developed regions (Greece, Italy and Slovenia) commit to maintain a pre-set level of public investment in the supported regions
[3] There is no accrual based cross-country comparative time series data available on the contribution of EU funds to national public investment. Table 2c in the Stability and Convergence Programmes contains information on public expenditure fully matched by EU funds revenue, and as of 2015 (as of 2016 for some countries) there is information included in this table on investment fully matched by EU funds revenue
[4] A further issue complicating the analysis is that historically, additionality has been a requirement for the ERDF and the ESF, and not for the Cohesion Fund. The Cohesion Fund is a major contributor to national public investment
[5] The calculation method for the 2007-2013 additionality targets was different. There was no unified methodology across countries, either. The main difference in assessment is that in 2007-2013, verification aimed to capture all national structural expenditure (e.g. expenditure spent on the same types of investments as co-financed by the Structural Funds). In 2014-2020, verification only captures public investment, and the category of public investment also contains expenditure that would not be eligible under Cohesion policy
[6] This peak does not show in the EU fund inflows data. This can be due to the fact that public investment data is accrual based